

Ethereum’s YTD Movement Brings the Price Back to Yearly Opening
Ethereum price is back to the level from where it began. There is a marginal loss as the opening price during January $159, and now it is at $152. The upsurge is rumored to begin shortly. The traders are eagerly eyeing for the same. The current market scenario is also giving a similar indication. The prices of the major coins are escalating.
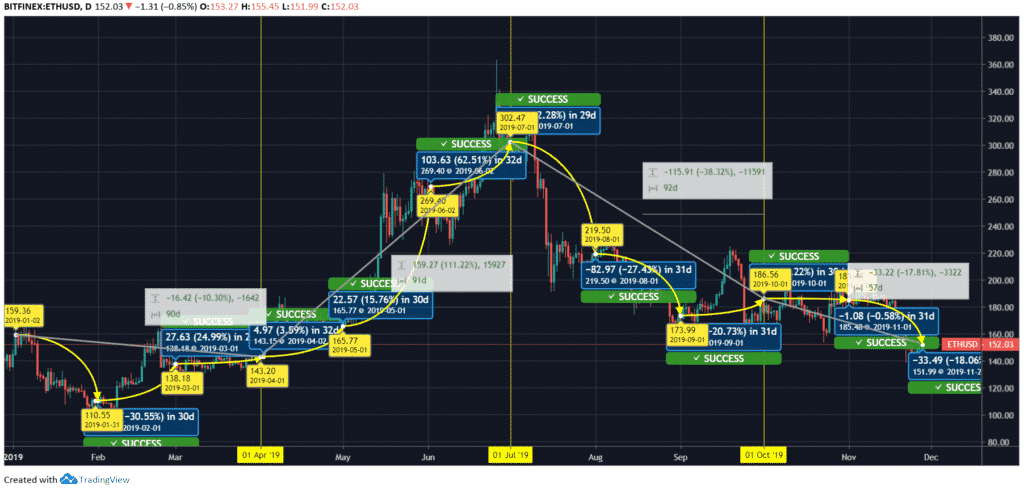
ETH/USD Price Chart:
Ethereum Price Analysis:
Ethereum began the year with regression. The counters moved from $159.36 to $110.55 by 30.55% in January. In February, the ETH price escalated by 24.99%. The price of the coin climbed to $138.18. The price jumped to $143.20 by 3.59%. The quarter marked a 10.30% loss in the coin. In April, the price of Ethereum moved to $165.77 from $143.20 by 15.76%. The uptrend continued and touched $269.40 by 62.51% in May. In June, the currency jumped to $302.47 by 12.28%. The quarter doubled the ETH price from $143 to $302. In July, the Ethereum price shifted to $219.50 from $302.47 by 27.43%. In August, the price moved to $173.99 by 20.73%. In September, the price improved and touched $186.56 by 7.22%. The quarter marked 38.32% regression in the ETH coin. In October, the coin moved around $186. In November, the price dropped to $151.99 by 18.06%.
Ethereum is anticipated to improve in the coming days. The investment in the coin is speculated to give the flourishing result. The traders looking to investment in Ethereum are suggested to opt for long-term investment. The specified period would give the desired return to the traders.
| Resistance Level | Price |
| R1 | $157.42 |
| R2 | $161.84 |
| R3 | $168.78 |
| Support Level | Price |
| S1 | $146.06 |
| S2 | $139.12 |
| S3 | $134.7 |
Ethereum is currently dealing at $152. Intraday trading seems to give a better return. The coin is moving towards the immediate level at $157. If the coin keeps the movement intact, Ethereum could touch the next support level $161.


Related articles


Ethereum is an open source, public, blockchain-based distributed computing platform.